
Key Performance Indicator
formulas and analysis
What are the mathematical analysis that we can do enough of profits to determine if they're operating efficiently and effectively?
Is your organization operating as intended, based on different targets and benchmarks around not for profits performance?
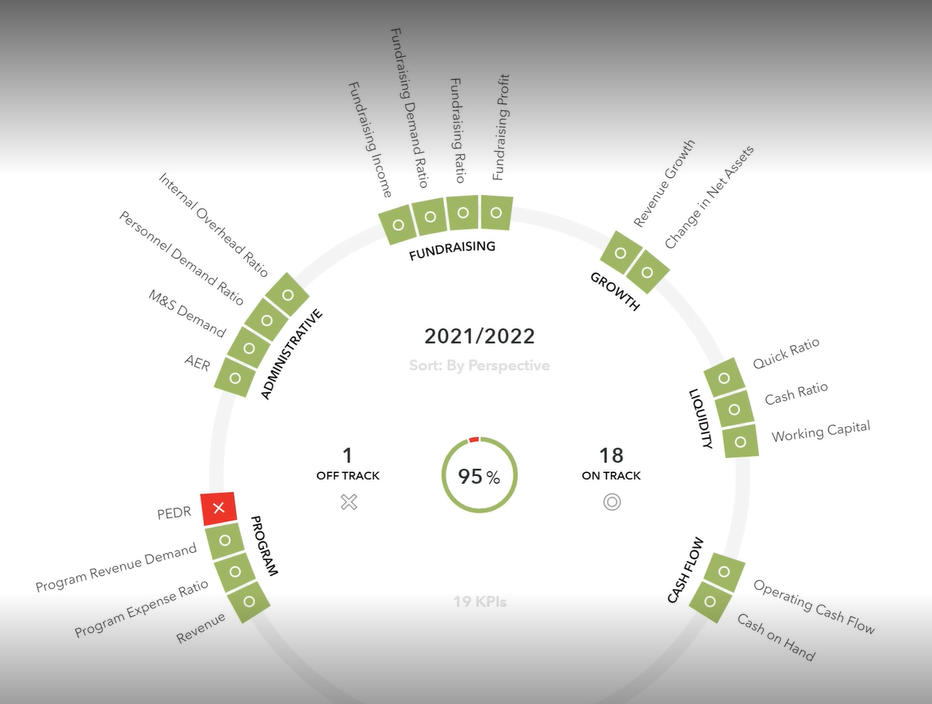
The KPI Chart displays how on track the organization is towards their KPI goals and even breaks them down into their own categories.
Although this organization isn't perfect, they're a perfect example for how properly the goals of their KPIs which in turn make sure operations that are intact and running smooth.
Program Expense
Demand Ratio
A measure of the percentage of total expenses that are related to program expenses.
Program revenue Demand
The amount of revenue currently required by organization "Programs" function
Revenue (Source) Reliance Ratio
Measurement of the reliance of a particular revenue source as a portion of the total revenue earned by the organization
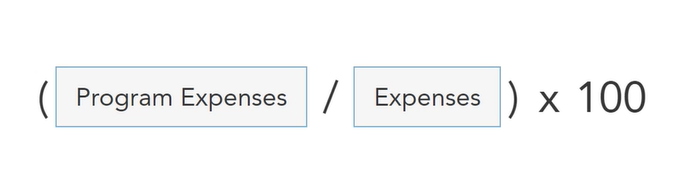
Program Expense Ratio Formula
By dividing Program Expenses by Total Expenses you determine the percentage related to program expenses.
This allows us to determine how much of the organization's funds are spent on programming verses other phases of their operations.
Target Ranges
The reasonable range for the organization's Program Expense Ratio is (75% to 90%)
Growth Expenses
Revenue Growth
A measure of the percentage change in revenue for the period. Managment should ensure that revenues increase at rates higher than general economic growth rates
Change in Net Assets
Subtract this year's total assets by last year's total assets.
Administrative Expenses
- Administrative Expense Ratio
The amount of Administrative Expenses as a percentage of total expenses.
- Managment & Support Demand
Reflects the percentage of Revenue required to support the Managment & Support Costs.
- Personnel Demand Ratio
The amount of Total Expanses are spent on Personnel Expenses.